The endoplasmic reticulum–mitochondria encounter structure (ERMES) tethers the endoplasmatic reticulum and mitochondria. It is a four-subunit complex whose stoichiometry and architecture were unknown.
Wide-filed microscopy images show subunits of the ERMES complex, tagged with EGFP as puncta. Spotquant, a tool for quantitative analysis, compared the brightness of these puncta with the kinetochore structures, whose stoichiometry is known. These structures acted as fiducials, calibrating the fluorescence intensity of the ERMES to measure the number of molecules.
The integration of the stoichiometry of the ERMES complex with cryo-correlative microscopy, subtomogram averaging and molecular modelling helped resolve the ERMES complex’s architecture with unprecedented detail.
References:
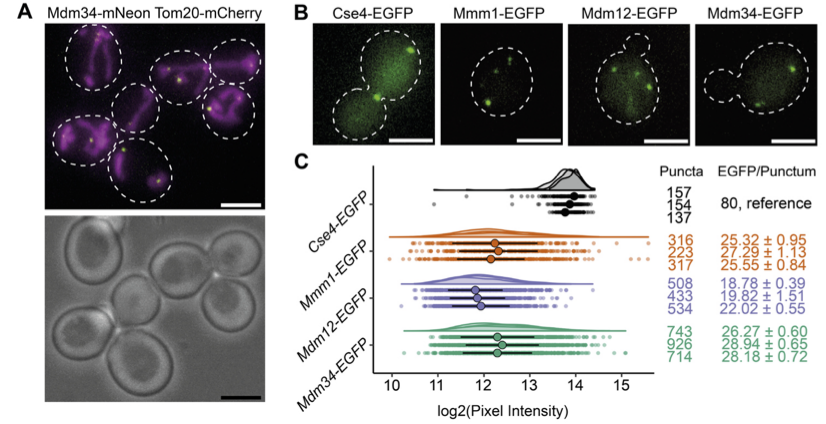 (A) Live cell imaging of budding yeast cells expressing Tom20-mCherry, marking mitochondria, and Mdm34-mNeonGreen, marking ERMES-mediated MCS. In the fluorescence image (top) white dashed outlines mark cell boundaries according to bright field image (bottom). (B) Live cell FM of yeast cells expressing either Cse4-EGFP, Mmm1-EGFP, Mdm12-EGFP or Mdm34-EGFP. White dashed outlines mark cell boundaries. Cells expressing the kinetochore protein Cse4-EGFP, of which the number of molecules per diffraction limited spot is known (36) were used as a reference to determine the number of molecules of ERMES components. (C) Fluorescence intensity quantifications of diffraction-limited puncta of EGFP-tagged Cse4 (grey), Mmm1 (orange), Mdm12 (purple) and Mdm34 (green), represented as dot plots as well as half-violin plots. For each quantification, three experimental repeats are shown. Large dots represent the median, lines the MAD, of each experimental repeat. Left column indicates number of analyzed puncta. Using Cse4-EGFP as reference, fluorescence intensities were transformed into numbers of EGFP molecules/punctum (right column), of which median values with MAD are given. Scale bars are 3 µm. (Wozny, et al., BiorXiv, 2022)